Comparação dos métodos numéricos
Ir para navegação
Ir para pesquisar
Gráfico do erro relativo
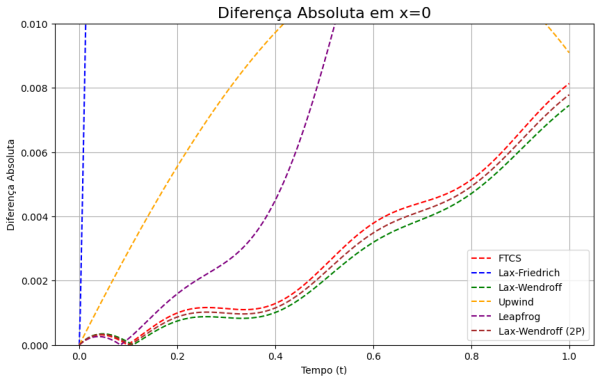
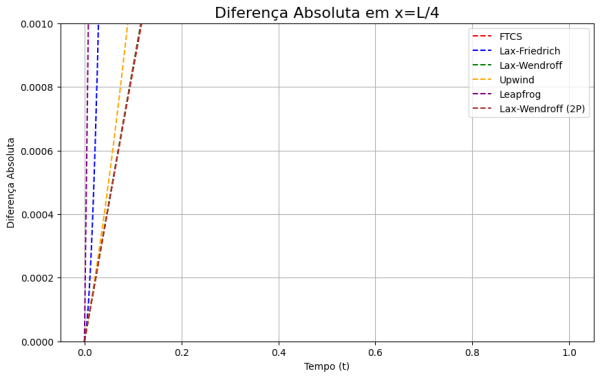
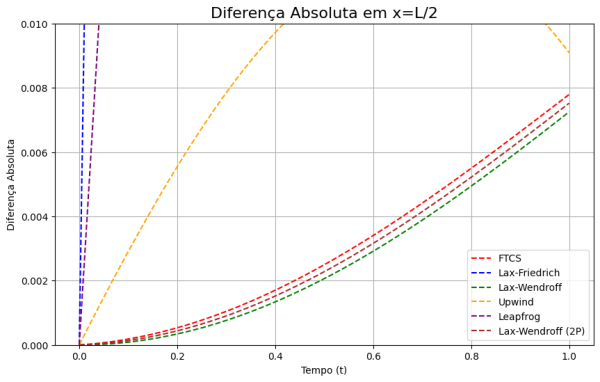
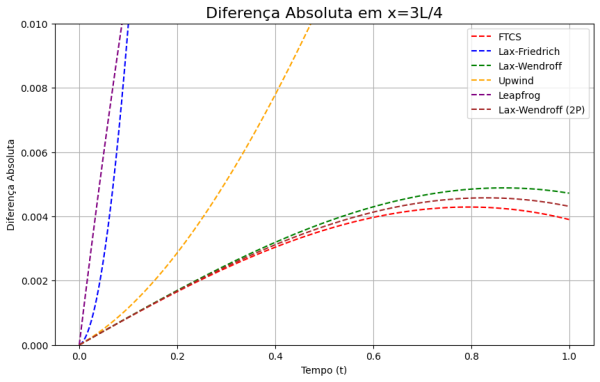
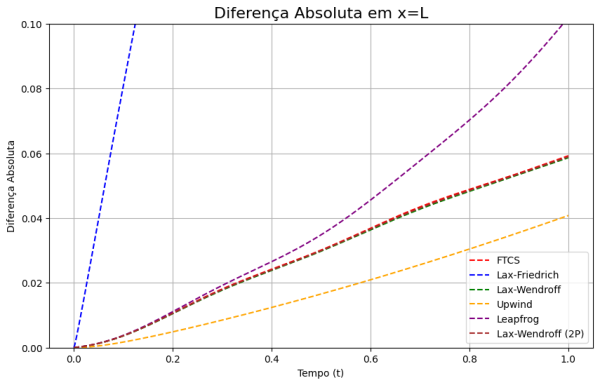
Como se evidencia nos gráficos que seguem, os métodos implícitos demonstram uma superioridade considerável, apresentando um menor erro relativo em comparação com a solução analítica. Nesse contexto, observamos que o método Crank-Nicholson exibe o menor erro relativo, seguido pelo esquema BTCS e pelo método Lax-Wendroff.
def dif(solv0, solv1):
    erro = np.zeros_like(solv0)

    for n in range(solv0.shape[0]):
        erro[n, :] = np.abs(solv0[n, :] - solv1[n, :])

    return erro

# Calcular a diferença absoluta
erro1 = dif(solv0, solv1)
erro2 = dif(solv0, solv2)
erro3 = dif(solv0, solv3)
erro4 = dif(solv0, solv4)
erro5 = dif(solv0, solv5)
erro6 = dif(solv0, solv6)
plt.figure(figsize=(10, 6))

plt.plot(listT, erro1[:, 0], label='FTCS', color='red', linestyle='--')
plt.plot(listT, erro2[:, 0], label='Lax-Friedrich', color='blue', linestyle='--')
plt.plot(listT, erro3[:, 0], label='Lax-Wendroff', color='green', linestyle='--')
plt.plot(listT, erro4[:, 0], label='Upwind', color='orange', linestyle='--')
plt.plot(listT, erro5[:, 0], label='Leapfrog', color='purple', linestyle='--')
plt.plot(listT, erro6[:, 0], label='Lax-Wendroff (2P)', color='brown', linestyle='--')

plt.grid()
plt.ylim(0,0.01)

plt.xlabel('Tempo (t)')
plt.ylabel('Diferença Absoluta')
plt.title('Diferença Absoluta em x=0', fontsize=16)
plt.legend()
plt.show()
plt.figure(figsize=(10, 6))

x = int(3* Nx / 4)

plt.plot(listT, erro1[:, x], label='FTCS', color='red', linestyle='--')
plt.plot(listT, erro2[:, x], label='Lax-Friedrich', color='blue', linestyle='--')
plt.plot(listT, erro3[:, x], label='Lax-Wendroff', color='green', linestyle='--')
plt.plot(listT, erro4[:, x], label='Upwind', color='orange', linestyle='--')
plt.plot(listT, erro5[:, x], label='Leapfrog', color='purple', linestyle='--')
plt.plot(listT, erro6[:, x], label='Lax-Wendroff (2P)', color='brown', linestyle='--')

plt.grid()
plt.ylim(0,0.001)

plt.xlabel('Tempo (t)')
plt.ylabel('Diferença Absoluta')
plt.title('Diferença Absoluta em x=L/4', fontsize=16)
plt.legend()
plt.show()
plt.figure(figsize=(10, 6))

x = int(Nx / 2)

plt.plot(listT, erro1[:, x], label='FTCS', color='red', linestyle='--')
plt.plot(listT, erro2[:, x], label='Lax-Friedrich', color='blue', linestyle='--')
plt.plot(listT, erro3[:, x], label='Lax-Wendroff', color='green', linestyle='--')
plt.plot(listT, erro4[:, x], label='Upwind', color='orange', linestyle='--')
plt.plot(listT, erro5[:, x], label='Leapfrog', color='purple', linestyle='--')
plt.plot(listT, erro6[:, x], label='Lax-Wendroff (2P)', color='brown', linestyle='--')

plt.grid()
plt.ylim(0,0.01)

plt.xlabel('Tempo (t)')
plt.ylabel('Diferença Absoluta')
plt.title('Diferença Absoluta em x=L/2', fontsize=16)
plt.legend()
plt.show()
plt.figure(figsize=(10, 6))

x = int(3* Nx / 4)

plt.plot(listT, erro1[:, x], label='FTCS', color='red', linestyle='--')
plt.plot(listT, erro2[:, x], label='Lax-Friedrich', color='blue', linestyle='--')
plt.plot(listT, erro3[:, x], label='Lax-Wendroff', color='green', linestyle='--')
plt.plot(listT, erro4[:, x], label='Upwind', color='orange', linestyle='--')
plt.plot(listT, erro5[:, x], label='Leapfrog', color='purple', linestyle='--')
plt.plot(listT, erro6[:, x], label='Lax-Wendroff (2P)', color='brown', linestyle='--')

plt.grid()
plt.ylim(0,0.01)

plt.xlabel('Tempo (t)')
plt.ylabel('Diferença Absoluta')
plt.title('Diferença Absoluta em x=3L/4', fontsize=16)
plt.legend()
plt.show()
plt.figure(figsize=(10, 6))

x = int(Nx)

plt.plot(listT, erro1[:, x], label='FTCS', color='red', linestyle='--')
plt.plot(listT, erro2[:, x], label='Lax-Friedrich', color='blue', linestyle='--')
plt.plot(listT, erro3[:, x], label='Lax-Wendroff', color='green', linestyle='--')
plt.plot(listT, erro4[:, x], label='Upwind', color='orange', linestyle='--')
plt.plot(listT, erro5[:, x], label='Leapfrog', color='purple', linestyle='--')
plt.plot(listT, erro6[:, x], label='Lax-Wendroff (2P)', color='brown', linestyle='--')

plt.grid()
plt.ylim(0,0.1)

plt.xlabel('Tempo (t)')
plt.ylabel('Diferença Absoluta')
plt.title('Diferença Absoluta em x=L', fontsize=16)
plt.legend()
plt.show()
